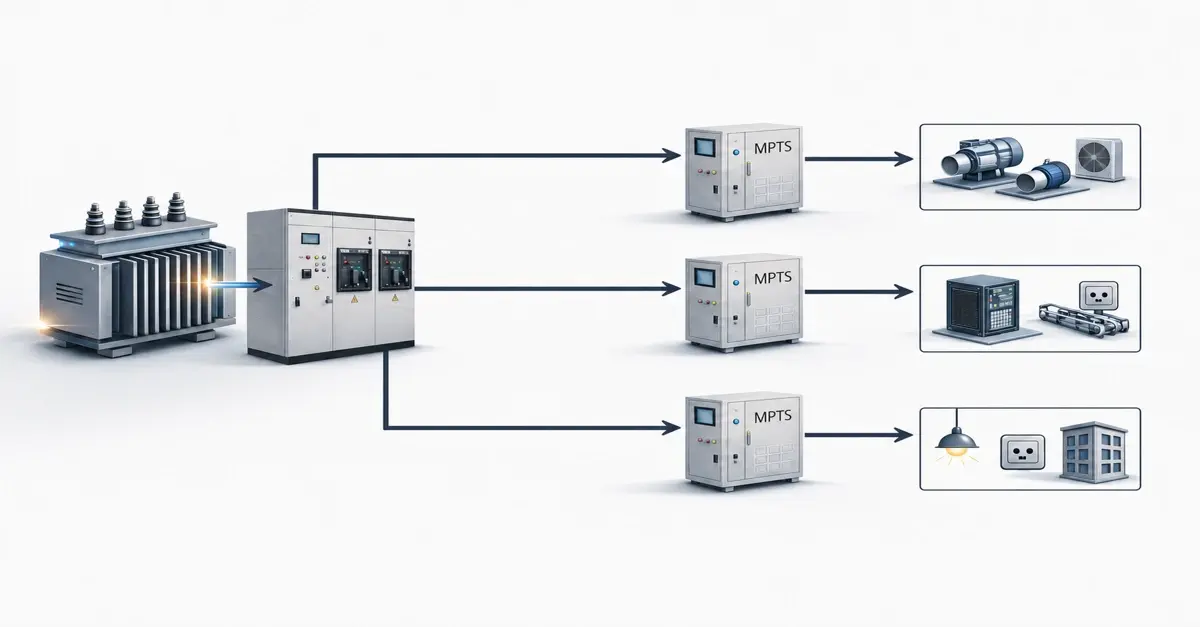
1× and 2× Maximum Power Transfer Solution Deployment
NORAD
At 3,000’ below in Cheyenne Mountain, very large compressors (one replaced annually) created pneumatic instead of conventional power because of the heat. Annual compressor replacement stopped after an MPTS 2015 installation, and none have been replaced since. At $480,000+ per compressor, saved since 2015, the CAPEX avoided = $5,280,000 vs $240,000 MPTS cost.
National Hospital
Prior to a 2019 chiller replacement at a cost of $1,000,080 due to poor, inefficient operation, MPTS was installed as a test to “clean the dirty power” and provide “as-per-design” operating conditions. The chiller is still operating. CAPEX avoided = $1,080,000 vs $240,000 MPTS cost.
School District
An Arizona School District high school’s I.T. building, with its associated server equipment and terminals, was hit with a 1,600V utility power surge. An MPTS unit installed in 2021 suppressed the surge without causing any damage. CAPEX avoided = $720,000 vs $120,000 MPTS cost.
County Prison
The prison, also a nonstop-producing factory, achieved its MPTS 1-year ROI by reducing preventive and emergency maintenance by 43%, enabling two technicians to be reassigned to the county courts rather than hiring new ones. CAPEX avoided $120,000 in MPTS costs.
Executive Summary
This report evaluates the return on investment for two deployment configurations of the Maximum Power Transfer Solution (MPTS): a single-unit (1× MPTS) at a fully installed cost of $200K, and a dual-unit (2× MPTS) at a fully installed cost of $400K. Both configurations are assessed across recurring OPEX savings, avoided capital expenditure (CAPEX), transformer asset recovery, and overall payback profile.
Both deployments address a critical infrastructure problem: power asset transformers operating beyond 100% capacity (the same applies to BESS, UPS, Gensets, and Solar). The MPTS resolves this by eliminating reactive power, reducing demand load, and recovering usable transformer capacity — deferring or eliminating the need for costly electrical infrastructure upgrades. MPTS is first and foremost a Power Management Control System (PMCS).

Deployment Comparison Overview
| Metric | 1× MPTS ($200K) | 2× MPTS ($400K) |
|---|---|---|
| Capital Investment | $200,000 | $400,000 |
| Annual OPEX Savings | $42,217 – $60,297 | $85,754 – $129,914 |
| CAPEX Avoided | $140K – $310K | $270K – $540K |
| Transformer Loading | 100%+ → 86% | 100%+ → 77% |
| Reactive Power Eliminated | 400 kVAR → −7 | 400 kVAR → −14 |
| Payback Period: Both / OPEX / CAPEX | 1-2 / 3-5 / 1-2 years | 1-2 / 3-5 / 1-2 years |
OPEX Assessment
Both deployment scenarios produce strong, recurring operational savings driven by four distinct mechanisms:
- Energy Savings
The 2× MPTS (600 kVA / 450 kW / 400 kVAR / 0.75 PF) deployment eliminates 245,280 kWh annually, and the 1× unit (360 kVA /300 kW / 200 kVAR / 0.83 PF) eliminates 122,640 kWh annually. At $0.12/kWh, this yields annual energy savings of approximately $29,434 and $14,717 respectively — a direct, measurable reduction in utility consumption. - Demand Charge Reduction
Demand savings follow directly from the kVA reductions achieved. The 2× deployment recovers 136 kVA on a 600 kVA transformer, generating $16,320–$24,480 per year in demand savings. The 1× unit frees 51 kVA on a 360 kVA transformer, yielding a more modest $5,100–$9,180 annually. - Power Factor Penalty Elimination
Both configurations eliminate power factor penalties charged by the utility. At 2% of the annual utility bill, this adds a clean, predictable saving of $9,000/year for the 2× configuration ($450K annual utility) and $5,400/year for the 1× ($270K annual utility). - Transformer & Cooling Loss Reduction
Reduced electrical losses in transformers and associated cooling infrastructure, combined with lower mechanical stress on equipment, contribute an estimated $16,000–$32,000 annually (2×) and $12,000–$16,000 (1×), alongside operational and maintenance savings of $15,000–$35,000 and $5,000–$15,000 respectively.
| OPEX Savings Category | 1× MPTS / Year | 2× MPTS / Year |
|---|---|---|
| Energy savings (kWh) | $14,717 | $29,434 |
| Demand charge reduction | $5,100 – $9,180 | $16,320 – $24,480 |
| Power factor penalty elimination | $5,400 | $9,000 |
| Transformer & cooling losses | $12,000 – $16,000 | $16,000 – $32,000 |
| Operational & maintenance | $5,000 – $15,000 | $15,000 – $35,000 |
| Total annual OPEX savings | $42,217 – $60,297 | $85,754 – $129,914 |
CAPEX Assessment
The more significant financial argument is the deferral and avoidance of capital expenditure. Both scenarios address transformers operating beyond 100% rated capacity. The MPTS resolves this without physical infrastructure replacement, avoiding the following capital outlays:
| Avoided CAPEX Item | 1× MPTS | 2× MPTS |
|---|---|---|
| Transformer replacement | $30K – $60K | $75K – $150K |
| Utility infrastructure upgrade | $30K – $75K | $40K – $80K |
| Backup capacity (GenSet/UPS) | $50K – $100K | $80K – $160K |
| Extended transformer service life | $30K – $75K | $75K – $150K |
| Total CAPEX avoided | $140K – $310K | $270K – $540K |
The 2× deployment reduces transformer loading to ~77%, providing significantly greater headroom for future load growth compared to the 1× unit’s ~86% loading. Both values represent safe operational targets versus the pre-deployment overload condition.
Payback & Risk-Adjusted View
The stated 1–2-year payback applies to both configurations and is credible if the CAPEX avoidance items are treated as near-term obligations rather than as hypothetical deferments.
Key considerations:
- If the transformer replacement, utility upgrade, or backup power generation has already been budgeted or is imminent, the ROI case is extremely strong, and the net payback may be achieved within the first year.
- If these expenditures remain discretionary, the OPEX-only payback of approximately 3–5 years remains a reasonable return for electrical infrastructure investment.
- The 2× deployment delivers approximately 2× the annual OPEX savings and 2× the CAPEX avoidance upside, meaning the incremental $200K investment for the second unit carries the same ROI profile as the first — an unusual characteristic suggesting both transformers are equally stressed.
- Reactive power correction to a slightly leading condition (−7 to −14 kVAR) is an optimal operating point, providing a built-in voltage-stability margin.
Strategic Asset Impact
Beyond the financial metrics, both deployments unlock operational and growth-oriented benefits:
- Eliminates infrastructure bottlenecks and overload risk without capital construction
- Enables facility growth without requiring new electrical service or transformer upgrades
- Improves power reliability, equipment longevity, and energy efficiency
- Frees 23% of transformer capacity (2×) or 14% (1×) for future load allocation
- Extends the useful service life of existing transformer assets
|
MPTS Financial Impact Summary 1 × MPTS Deployment — $200K (All inclusive) |
MPTS Financial Impact Summary 2 × MPTS Deployment — $400K (All inclusive) |
|
|---|---|---|
| Annual OPEX Savings | $86K – $130K Annual OPEX Savings (Validated + modeled recurring operational savings) |
$86K – $130K Annual OPEX Savings (Validated + modeled recurring operational savings) |
| ANNUAL SAVINGS BREAKDOWN | ||
| Energy Savings | ~122,640 kWh reduced annually ≈ $14,717 / year ($0.12 / kWh) |
~245,280 kWh reduced annually ≈ $29,434 / year ($0.12 / kWh) |
| Demand Savings | 51 kVA reduction ≈ $5,100 – $9,180 / year ($10 – $15 / kW) |
136 kVA reduction ≈ $16,320 – $24,480 / year ($10 – $15 / kW) |
| Power Factor Penalty Elimination | 2% of $270K per annum ≈ $5,400 / year (2% of $450K) |
2% of $450K per annum ≈ $9,000 / year (2% of $450K) |
| Reduced Transformer Losses & Cooling | ≈ $12,000 – $16,000 | ≈ $16,000 – $32,000 |
| Operational Efficiency & Maintenance Reduction | Lower losses, cooling, and equipment stress ≈ $5,000 – $15,000 / year |
Lower losses, cooling, and equipment stress ≈ $15,000 – $35,000 / year |
| Total Verified Savings | $42,217 – $60,297 per year | $85,754 – $129,914 per year |
| STRATEGIC ASSET IMPACT | ||
| Transformer Capacity Recovered | 14% — 51 kVA freed on a 360 kVA transformer | 23% — 136 kVA freed on a 600 kVA transformer |
| Loading Reduction | 100%+ overloaded → ~86% optimized operation | 100%+ overloaded → ~77% optimized operation |
| Reactive Power Eliminated | 400 kVAR → ~ -7 (slightly leading optimal condition) | 400 kVAR → ~ -14 (slightly leading optimal condition) |
| FINANCIAL INTERPRETATION — AVOIDED / DEFERRED CAPITAL EXPENSE | ||
| Transformer replacement avoided | $30K – $60K | $75K – $150K |
| Utility upgrade | $30K – $75K | $40K – $80K |
| Backup capacity (GenSet/UPS) | $50K – $100K | $80K – $160K |
| Extended transformer service life | $30K – $75K | $75K – $150K |
| Total CAPEX Avoided | $140K – $310K | $270K – $540K |
| EXECUTIVE TAKEAWAY | ||
| Capital Investment | $200K (1 × MPTS) | $400K (2 × MPTS) |
| Recurring Annual OPEX Savings | $42K – $60K | $81K – $130K |
| CAPEX Avoided | $140K – $310K | $270K – $540K |
| Payback | ~1–2 years (OPEX / CAPEX included) | ~1–2 years (OPEX / CAPEX included) |
| Eliminates infrastructure bottlenecks & overload risk Enables growth without electrical upgrades Improves reliability, efficiency, and asset life |
Eliminates infrastructure bottlenecks & overload risk Enables growth without electrical upgrades Improves reliability, efficiency, and asset life |
|
Terminology Reference
| Acronym | Definition |
|---|---|
| MPTS | Maximum Power Transfer Solution |
| PMCS | Power Management Control System |
| OPEX | Operating Expenditure — recurring operational costs |
| CAPEX | Capital Expenditure — one-time infrastructure investment |
| kVA | Kilovolt-Ampere — measure of apparent power |
| kVAR | Kilovolt-Ampere Reactive — measure of reactive power |
| kWh | Kilowatt-Hour — measure of energy consumption |